Advanced Debugging
Snipe-IT ships with the Laravel Debugbar, an amazing piece of software that lets you introspect much further into the framework and application to troubleshoot issues that may be a little harder to track down.
To enable the debugbar, set the following in your .env file, and clear your config cache:
APP_DEBUG=trueClear your config cache by running:
php artisan config:cache(This will dump your old cache, and then cache your new settings.)
IMPORTANTWhen you're done debugging your issue, set your APP_DEBUG back to false and clear your config cache again. Not doing so will expose sensitive information about your system that could make it vulnerable to attack.
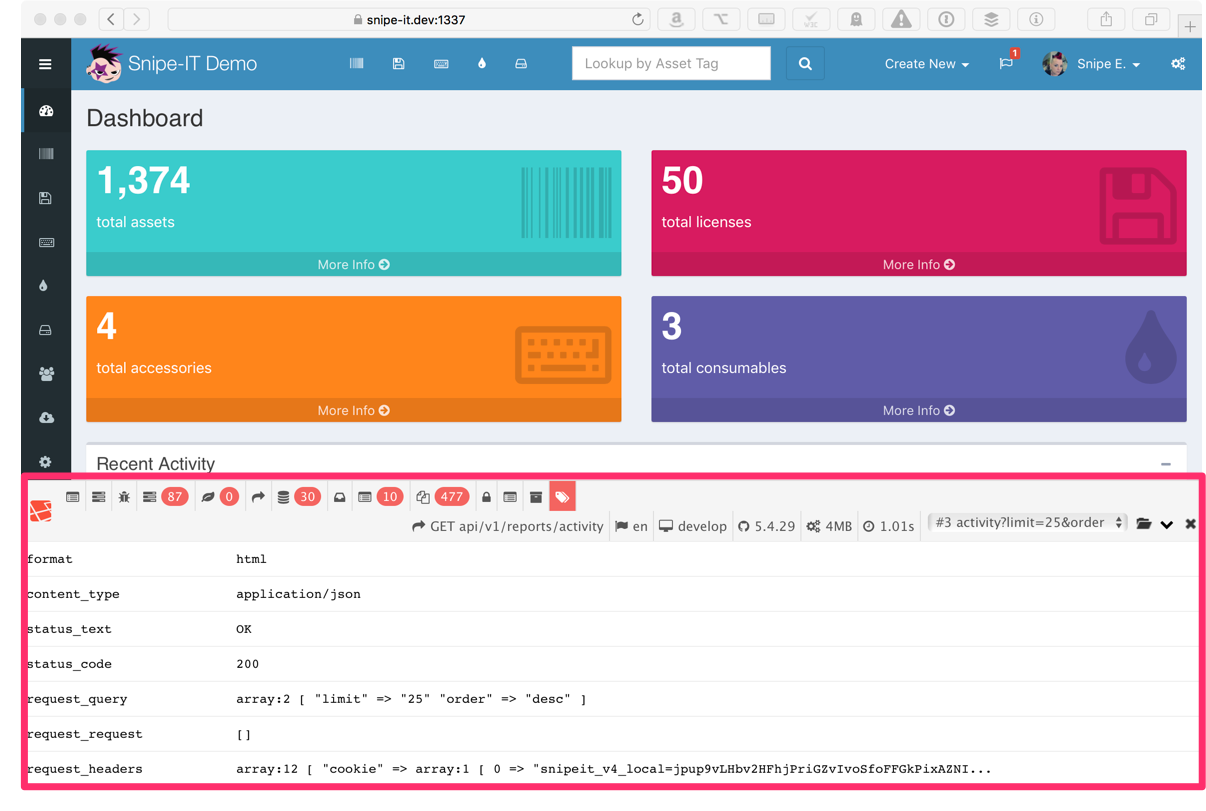
When you reload, you should see the debugbar at the bottom of the screen.
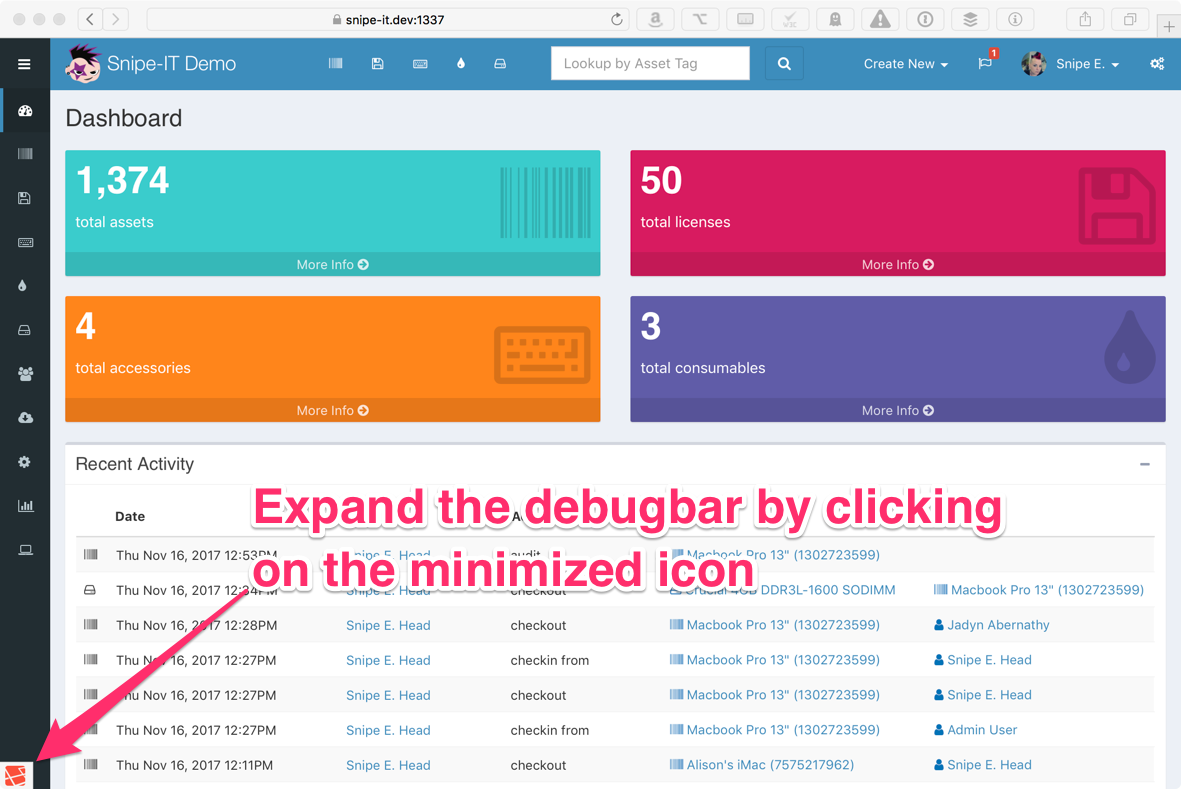
If the debugbar isn't visible, look for a small orange icon in the bottom left of the screen and click on that to expand it.
Once the debugbar is expanded, you'll see several icons at the top of the debugbar console. Clicking on these will give you information about different parts of the application.
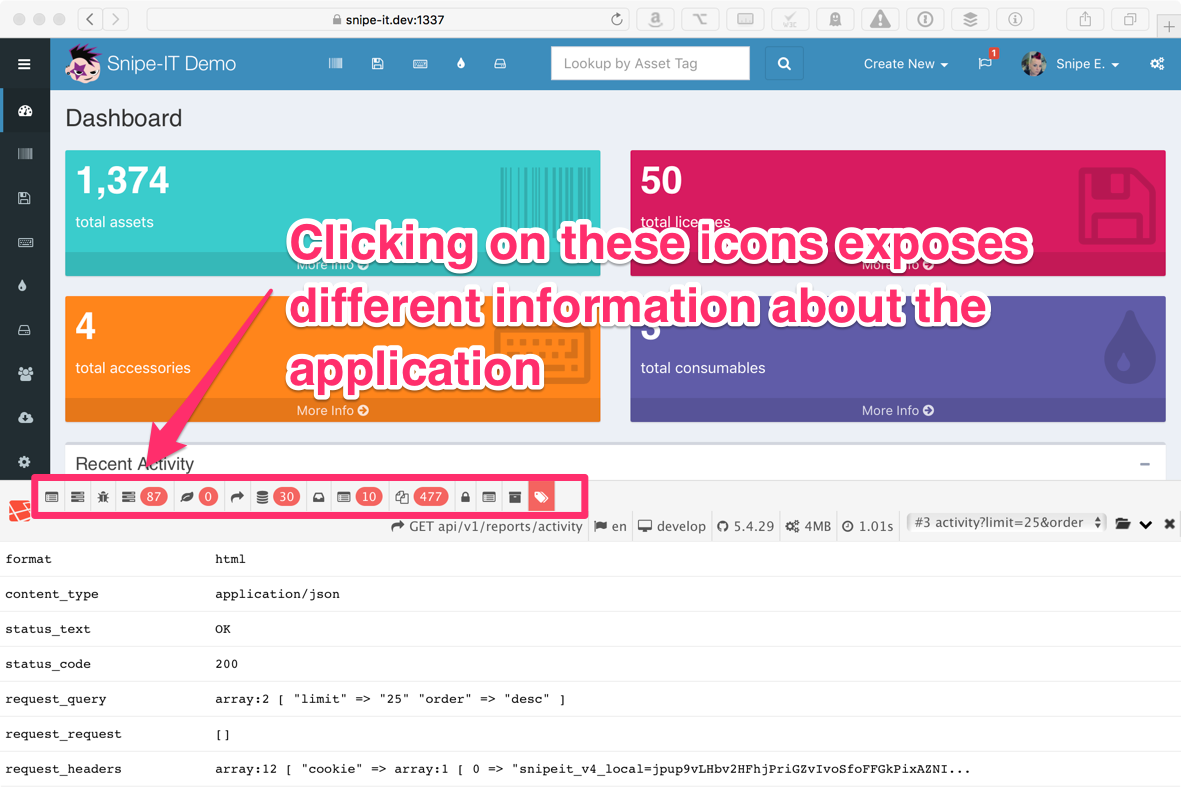
If you're trying to troubleshoot a query, for example, you might click on the Queries icon.
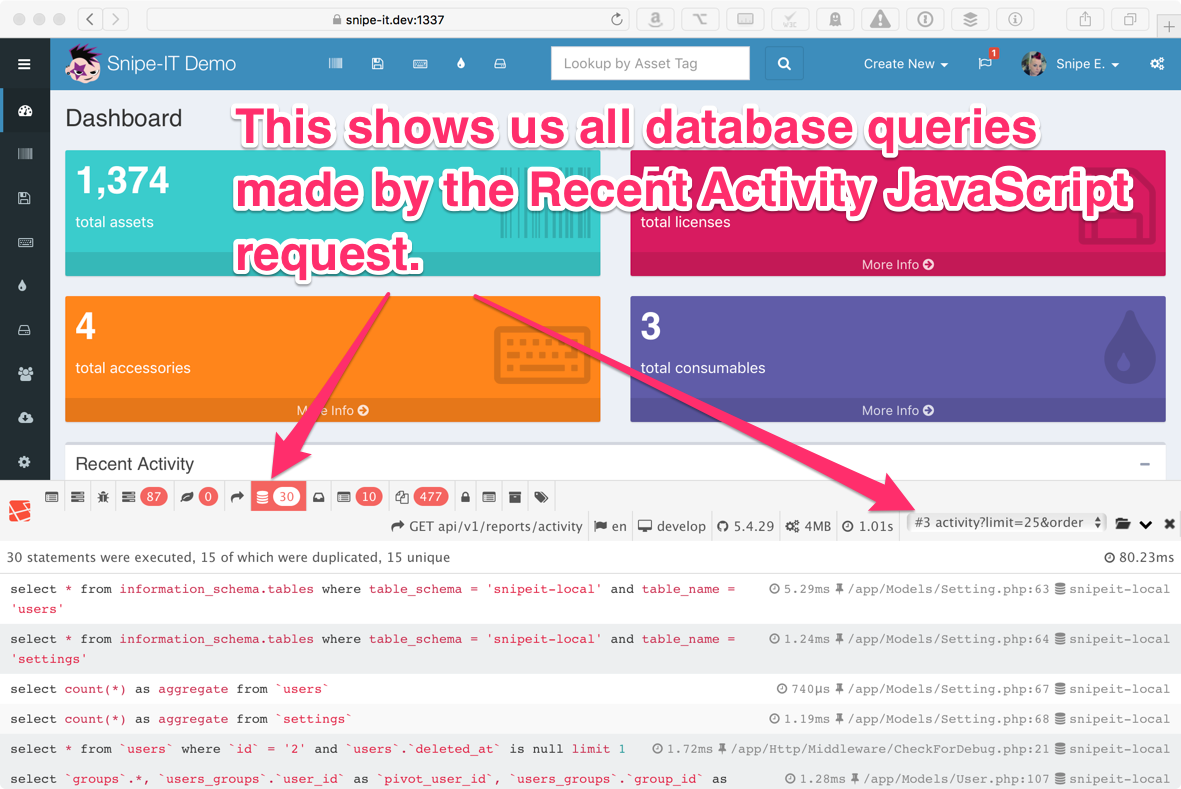
Some request within Snipe-IT are made by JavaScript/Ajax requests. To introspect on those use the dropdown on the top right of the debugbar.
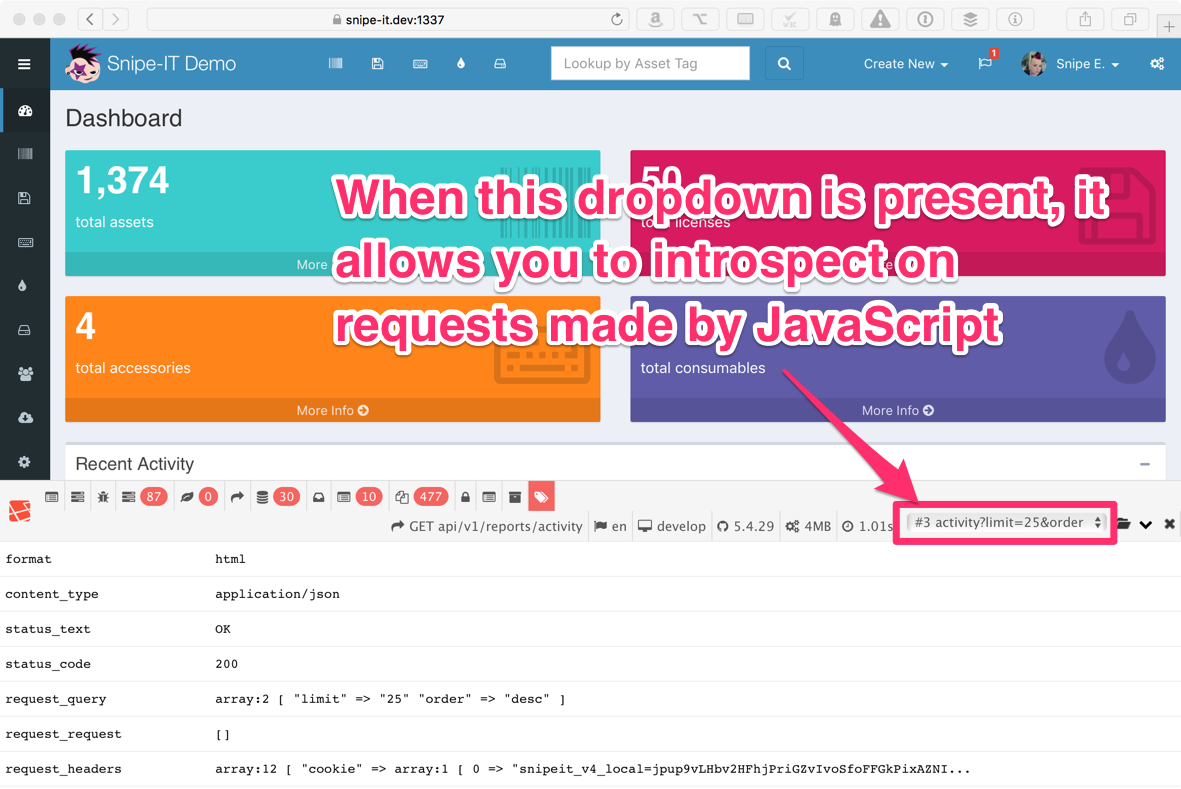
For example, selecting the Queries icon and selecting activity from the dropdown let's us introspect into all of the queries that are being run by the Activity Report Ajax request made by the dashboard.
IMPORTANTWhen you're done debugging your issue, set your APP_DEBUG back to false and clear your config cache again. Not doing so will expose sensitive information about your system that could make it vulnerable to attack. (Yes, this is so important, we had to say it twice.)
Updated 23 days ago
